Arkadia: an event-driven home environment monitor
- Michael Alonge
- IoT , Hardware , Software Engineering
- 26 Aug, 2026
Arkadia is a home environment monitoring system I built for a mix of personal and professional reasons. Firstly, I wanted a system of my own for monitoring indoor climate and air quality at home in Los Angeles, a city prone to heat waves and wildfires. I also wanted experience with edge and IoT software engineering. Most of my professional work is in the cloud, and this was an opportunity to work closer to the hardware. Finally, I am a musician and I am interested in guitar audio signal processing. Integrating a microphone into the system lets me monitor noise levels to protect my ears, and visualizing the sound in the room as it happens helps me learn more about audio processing.
A typical hobby environment monitor connects everything directly: one Python script reads the sensors in sequence, bundles the readings, and writes them to a display. But that approach is brittle. If one sensor is down, or you want to add a new one, or you want to show or analyze the data differently, even a small change impacts the whole program. Once I decided to build this, I wanted to build it the way I would build something at work, so that I could keep extending it and so that I would get real practice with the concepts I use professionally.
The project is named after the Skaikru base camp in the book and TV series The 100.
What I built, from the top down
All the code for the project is on GitHub at malonge/Arkadia.
At the top of the stack is a web dashboard as a single place to monitor all of the sensors and the current state of my home environment. I went with a lo-fi analog look because, for whatever reason, I wanted to feel like I was sitting in the control room of an old nuclear plant. There are three panels. Climate shows temperature as a block gauge, along with humidity and pressure. Air quality shows a CO₂ bar, a VOC indicator that changes color along the scale, and a second temperature and humidity reading from the CO₂ sensor. Audio is my favorite part of the dashboard, and the one that is truly live: an eight-band EQ, a waveform, and a rolling average of the room’s sound level. The dashboard also provides indicators for sensor health and timing.
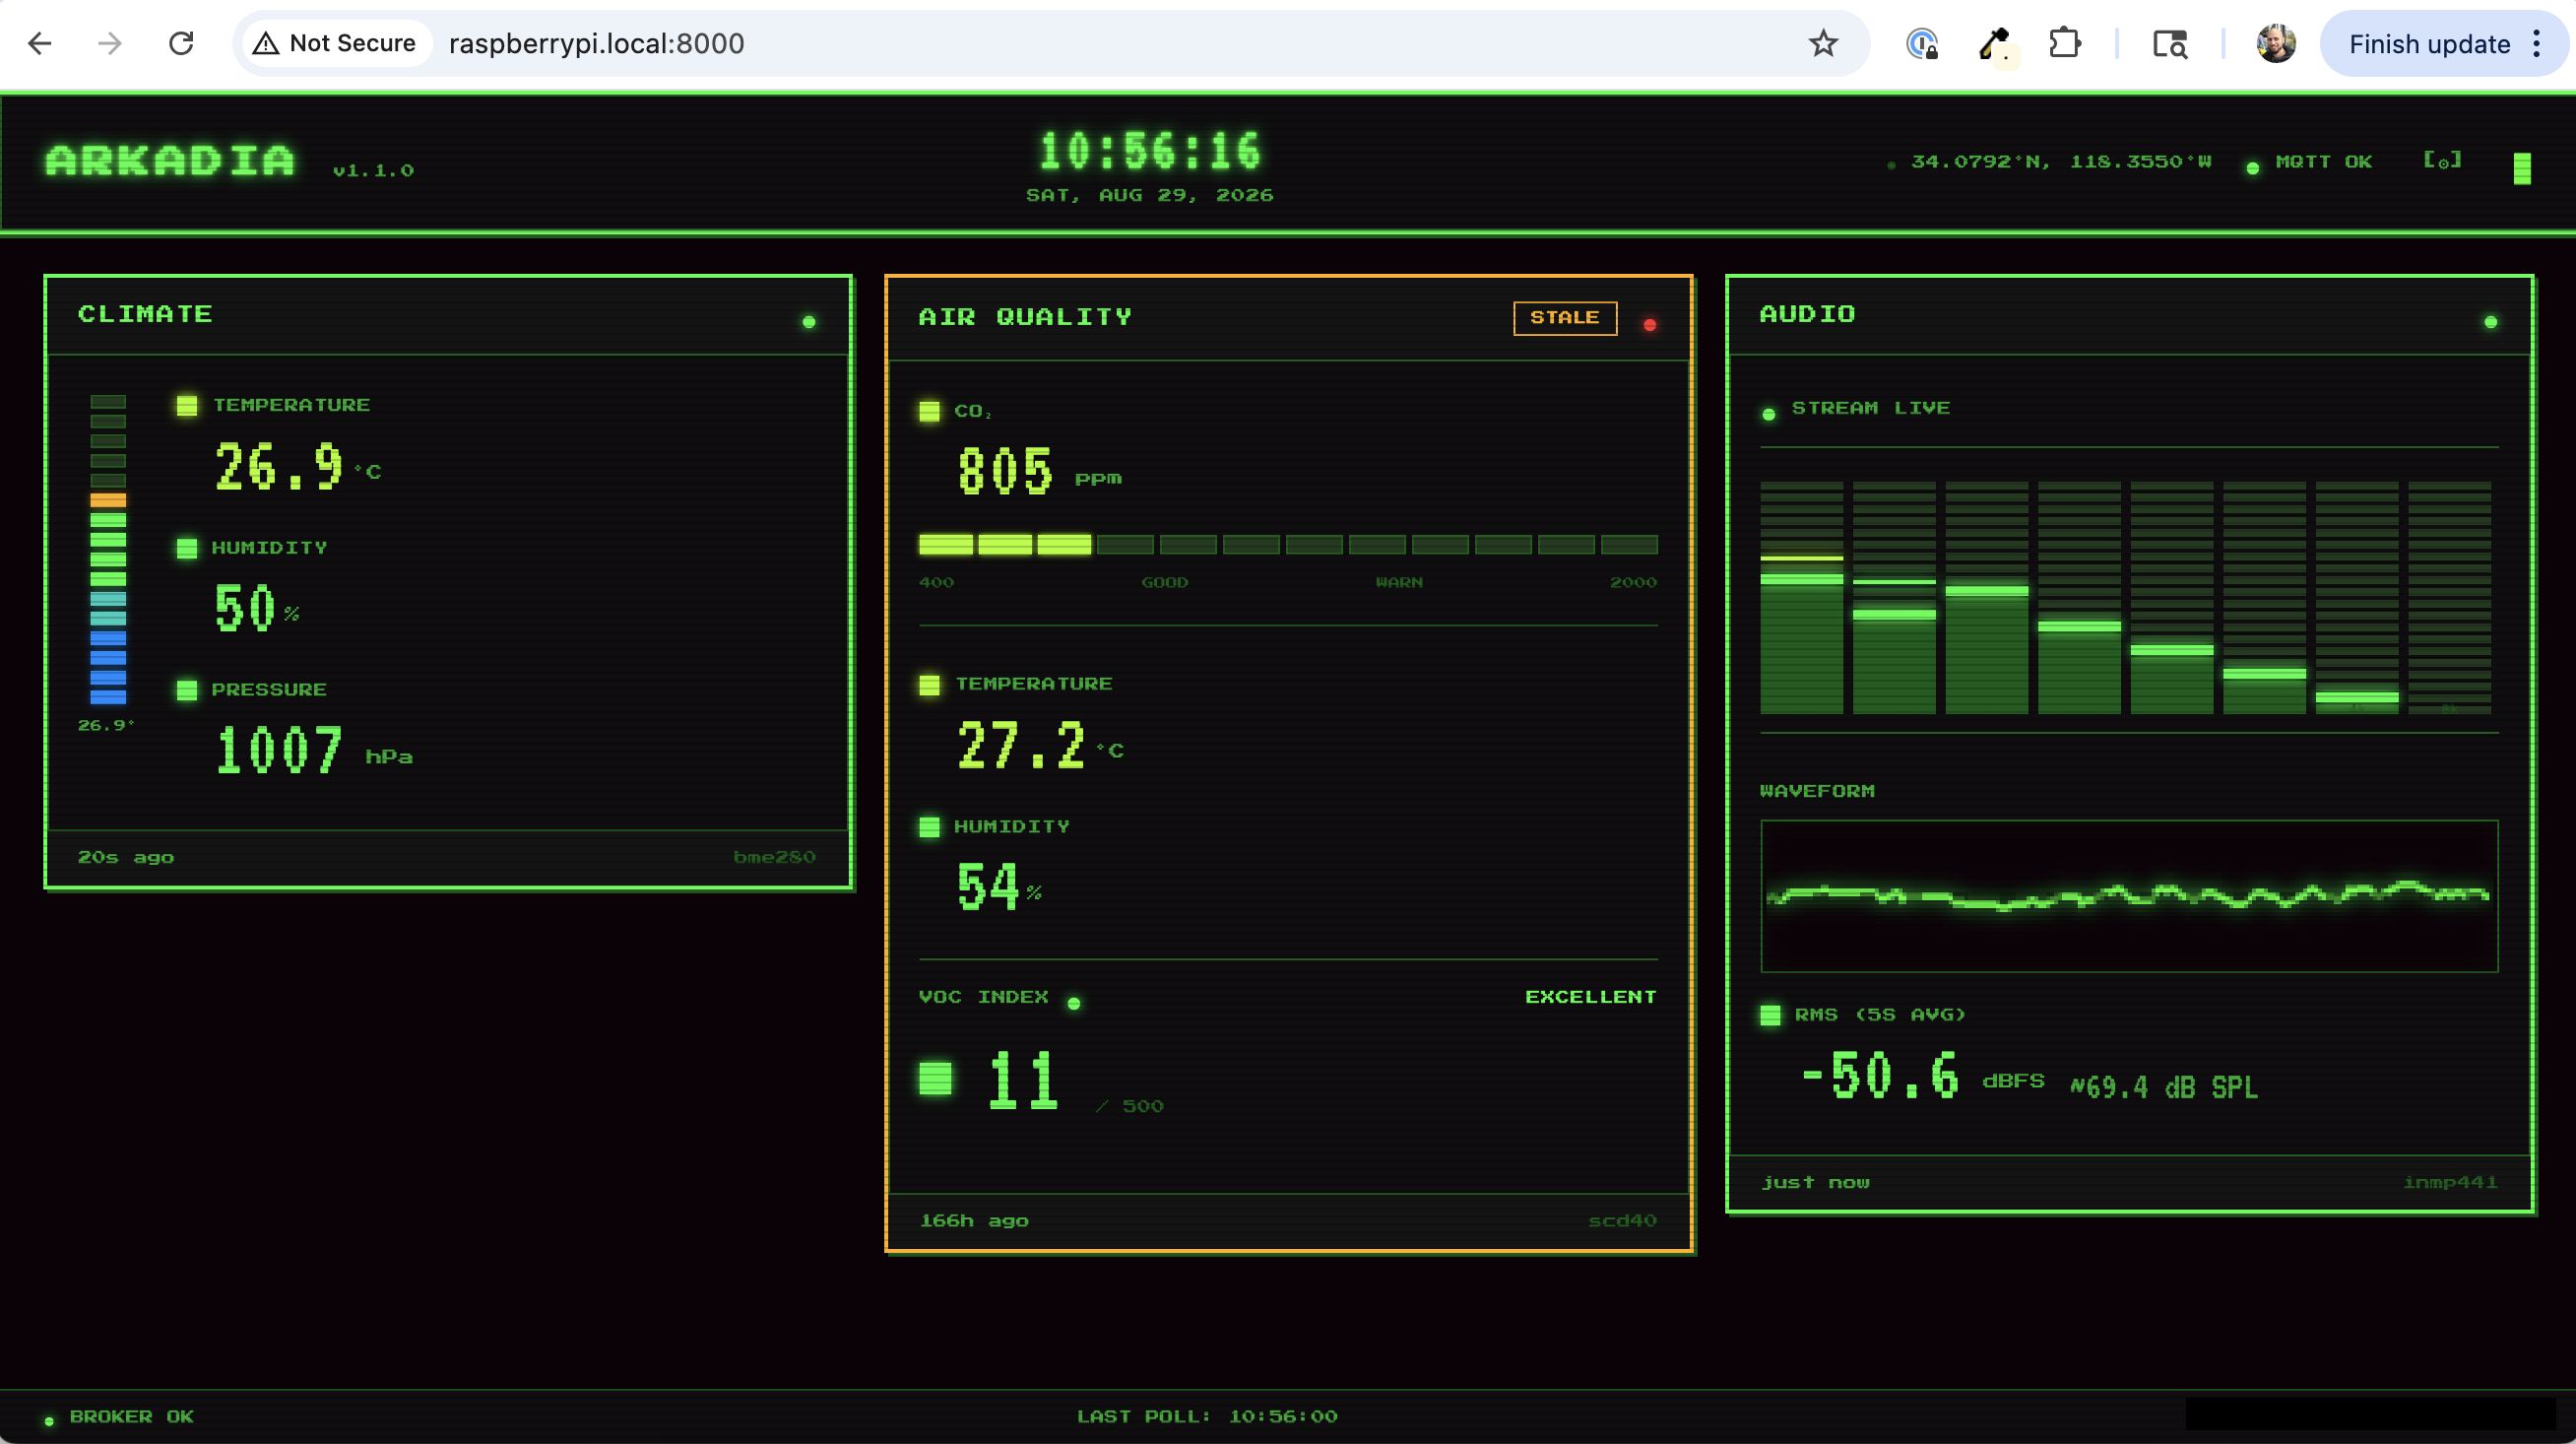
The UI is still pretty crude, but it gives a good idea of the direction I would go as I add more sensors and clean up the system. Long term, I would rather display the information on an LED matrix than a web page.
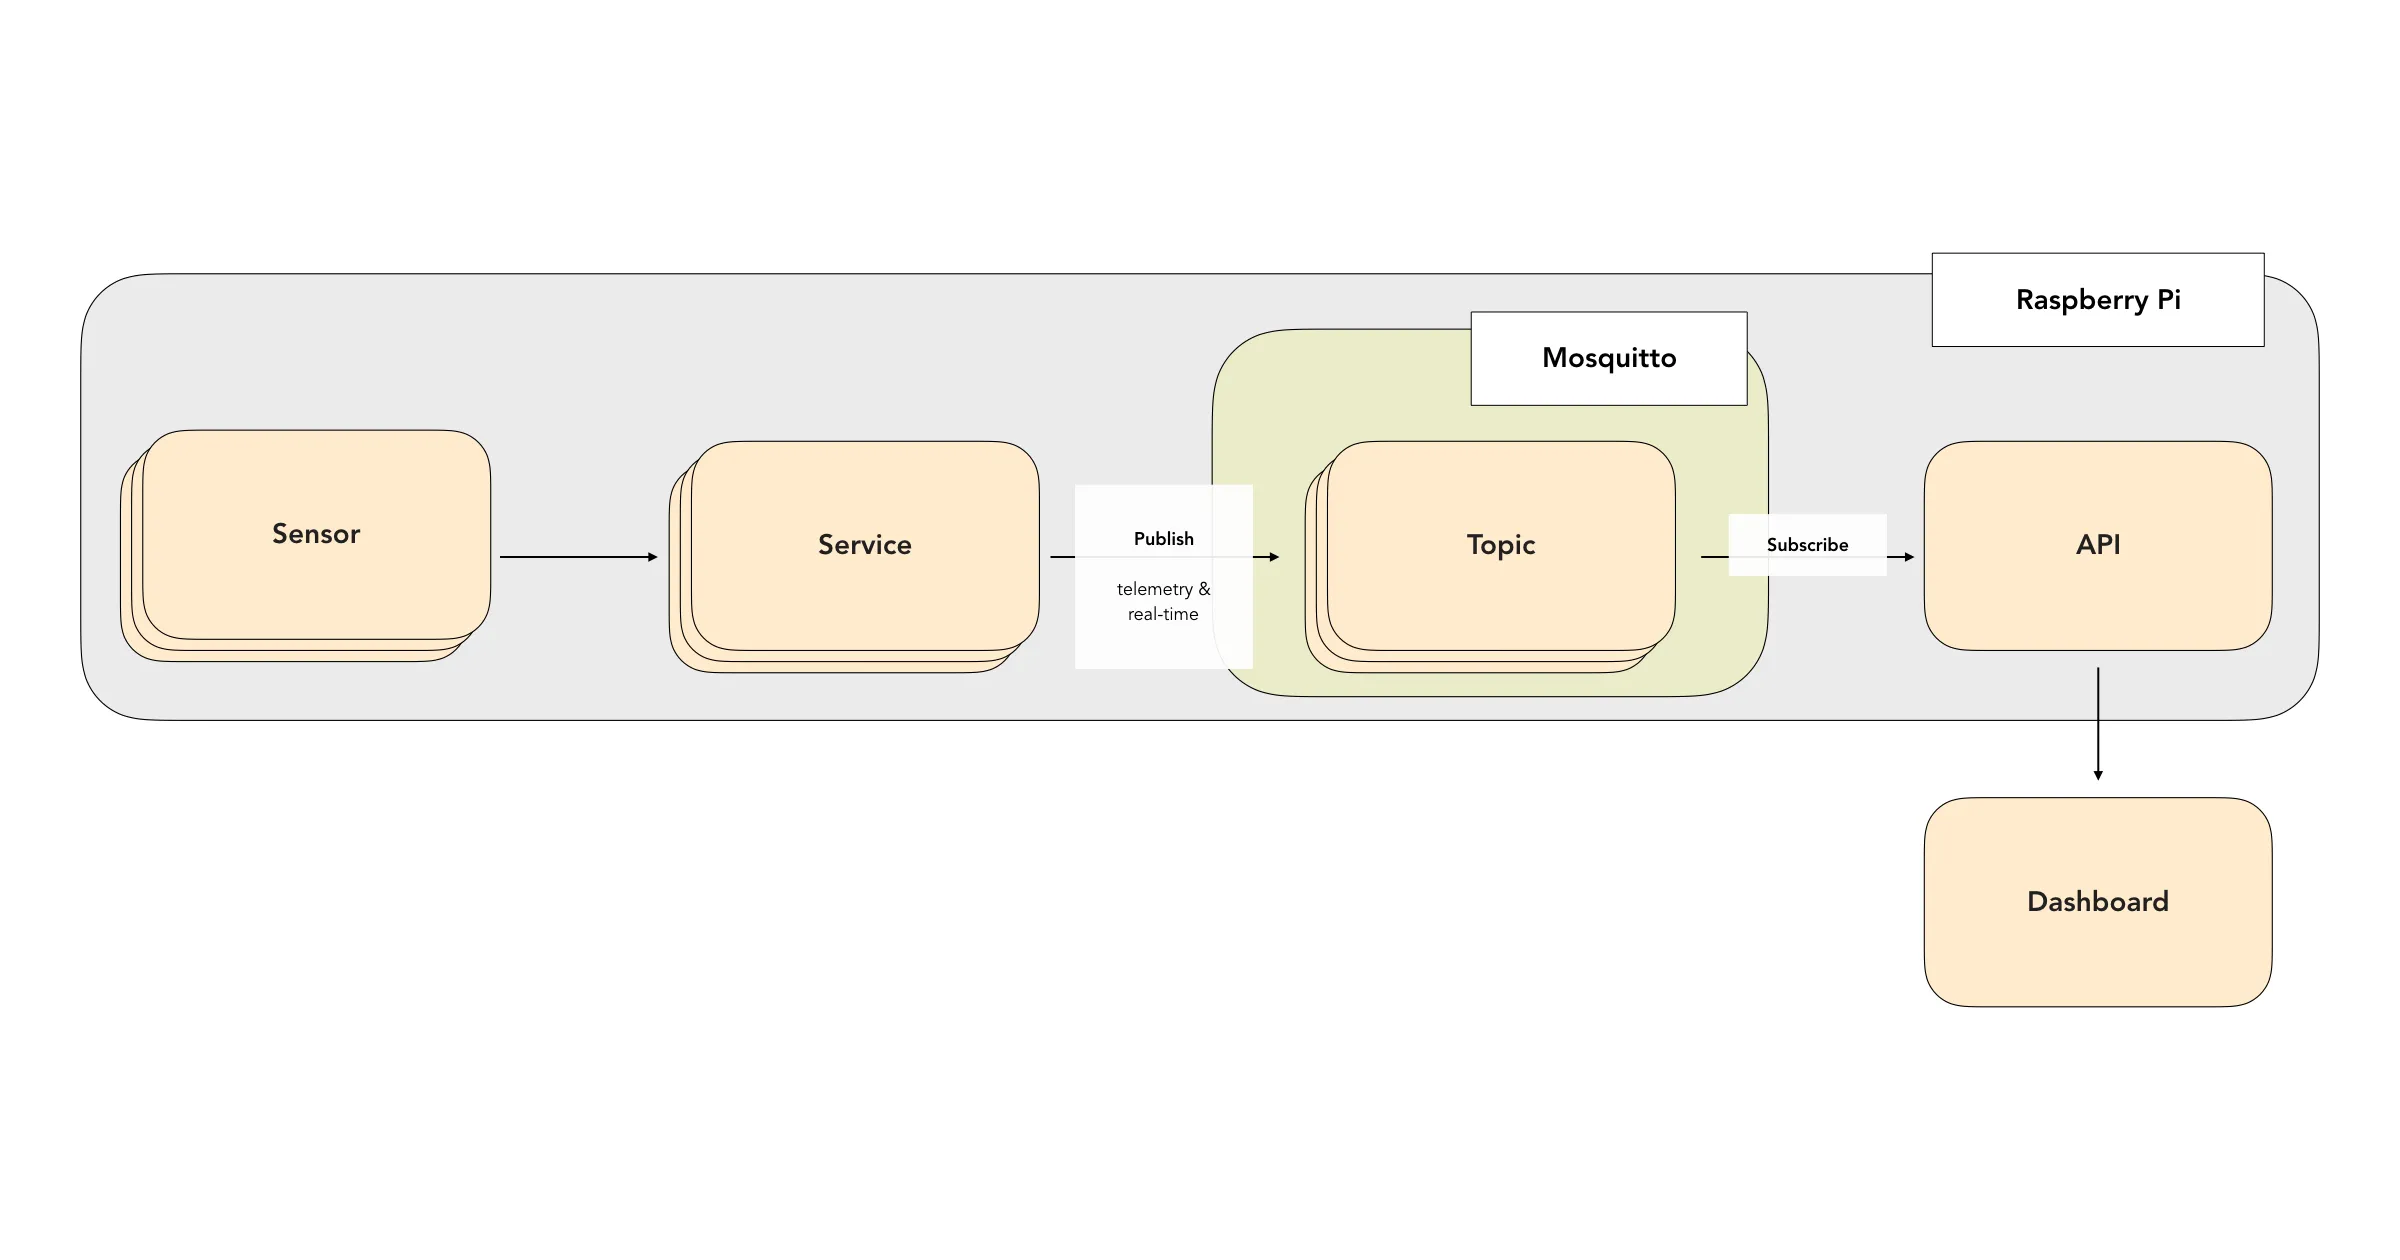
The API is a systemd service that starts when the Raspberry Pi boots. It serves the dashboard on port 8000, which can be reached from any device on the local network, and exposes the data under /api. REST endpoints return the latest reading for each sensor, and the dashboard polls those. The EQ and waveform need a continuous stream, so those come over a WebSocket. The API reads from a local Mosquitto broker that the rest of the system publishes to, rather than talking to the sensors itself.
Each sensor has its own process. That process reads from the hardware, does any quality checks or aggregation the sensor needs, and publishes to the broker.
At the bottom of the stack is the circuit with four sensors so far:
- BME280 — temperature, humidity, and barometric pressure. I2C, address
0x76. - SCD40 — CO₂, temperature, and humidity. I2C, address
0x62. - SGP40 — volatile organic compounds as a single VOC Index. I2C, address
0x59. - INMP441 — an I2S MEMS microphone.
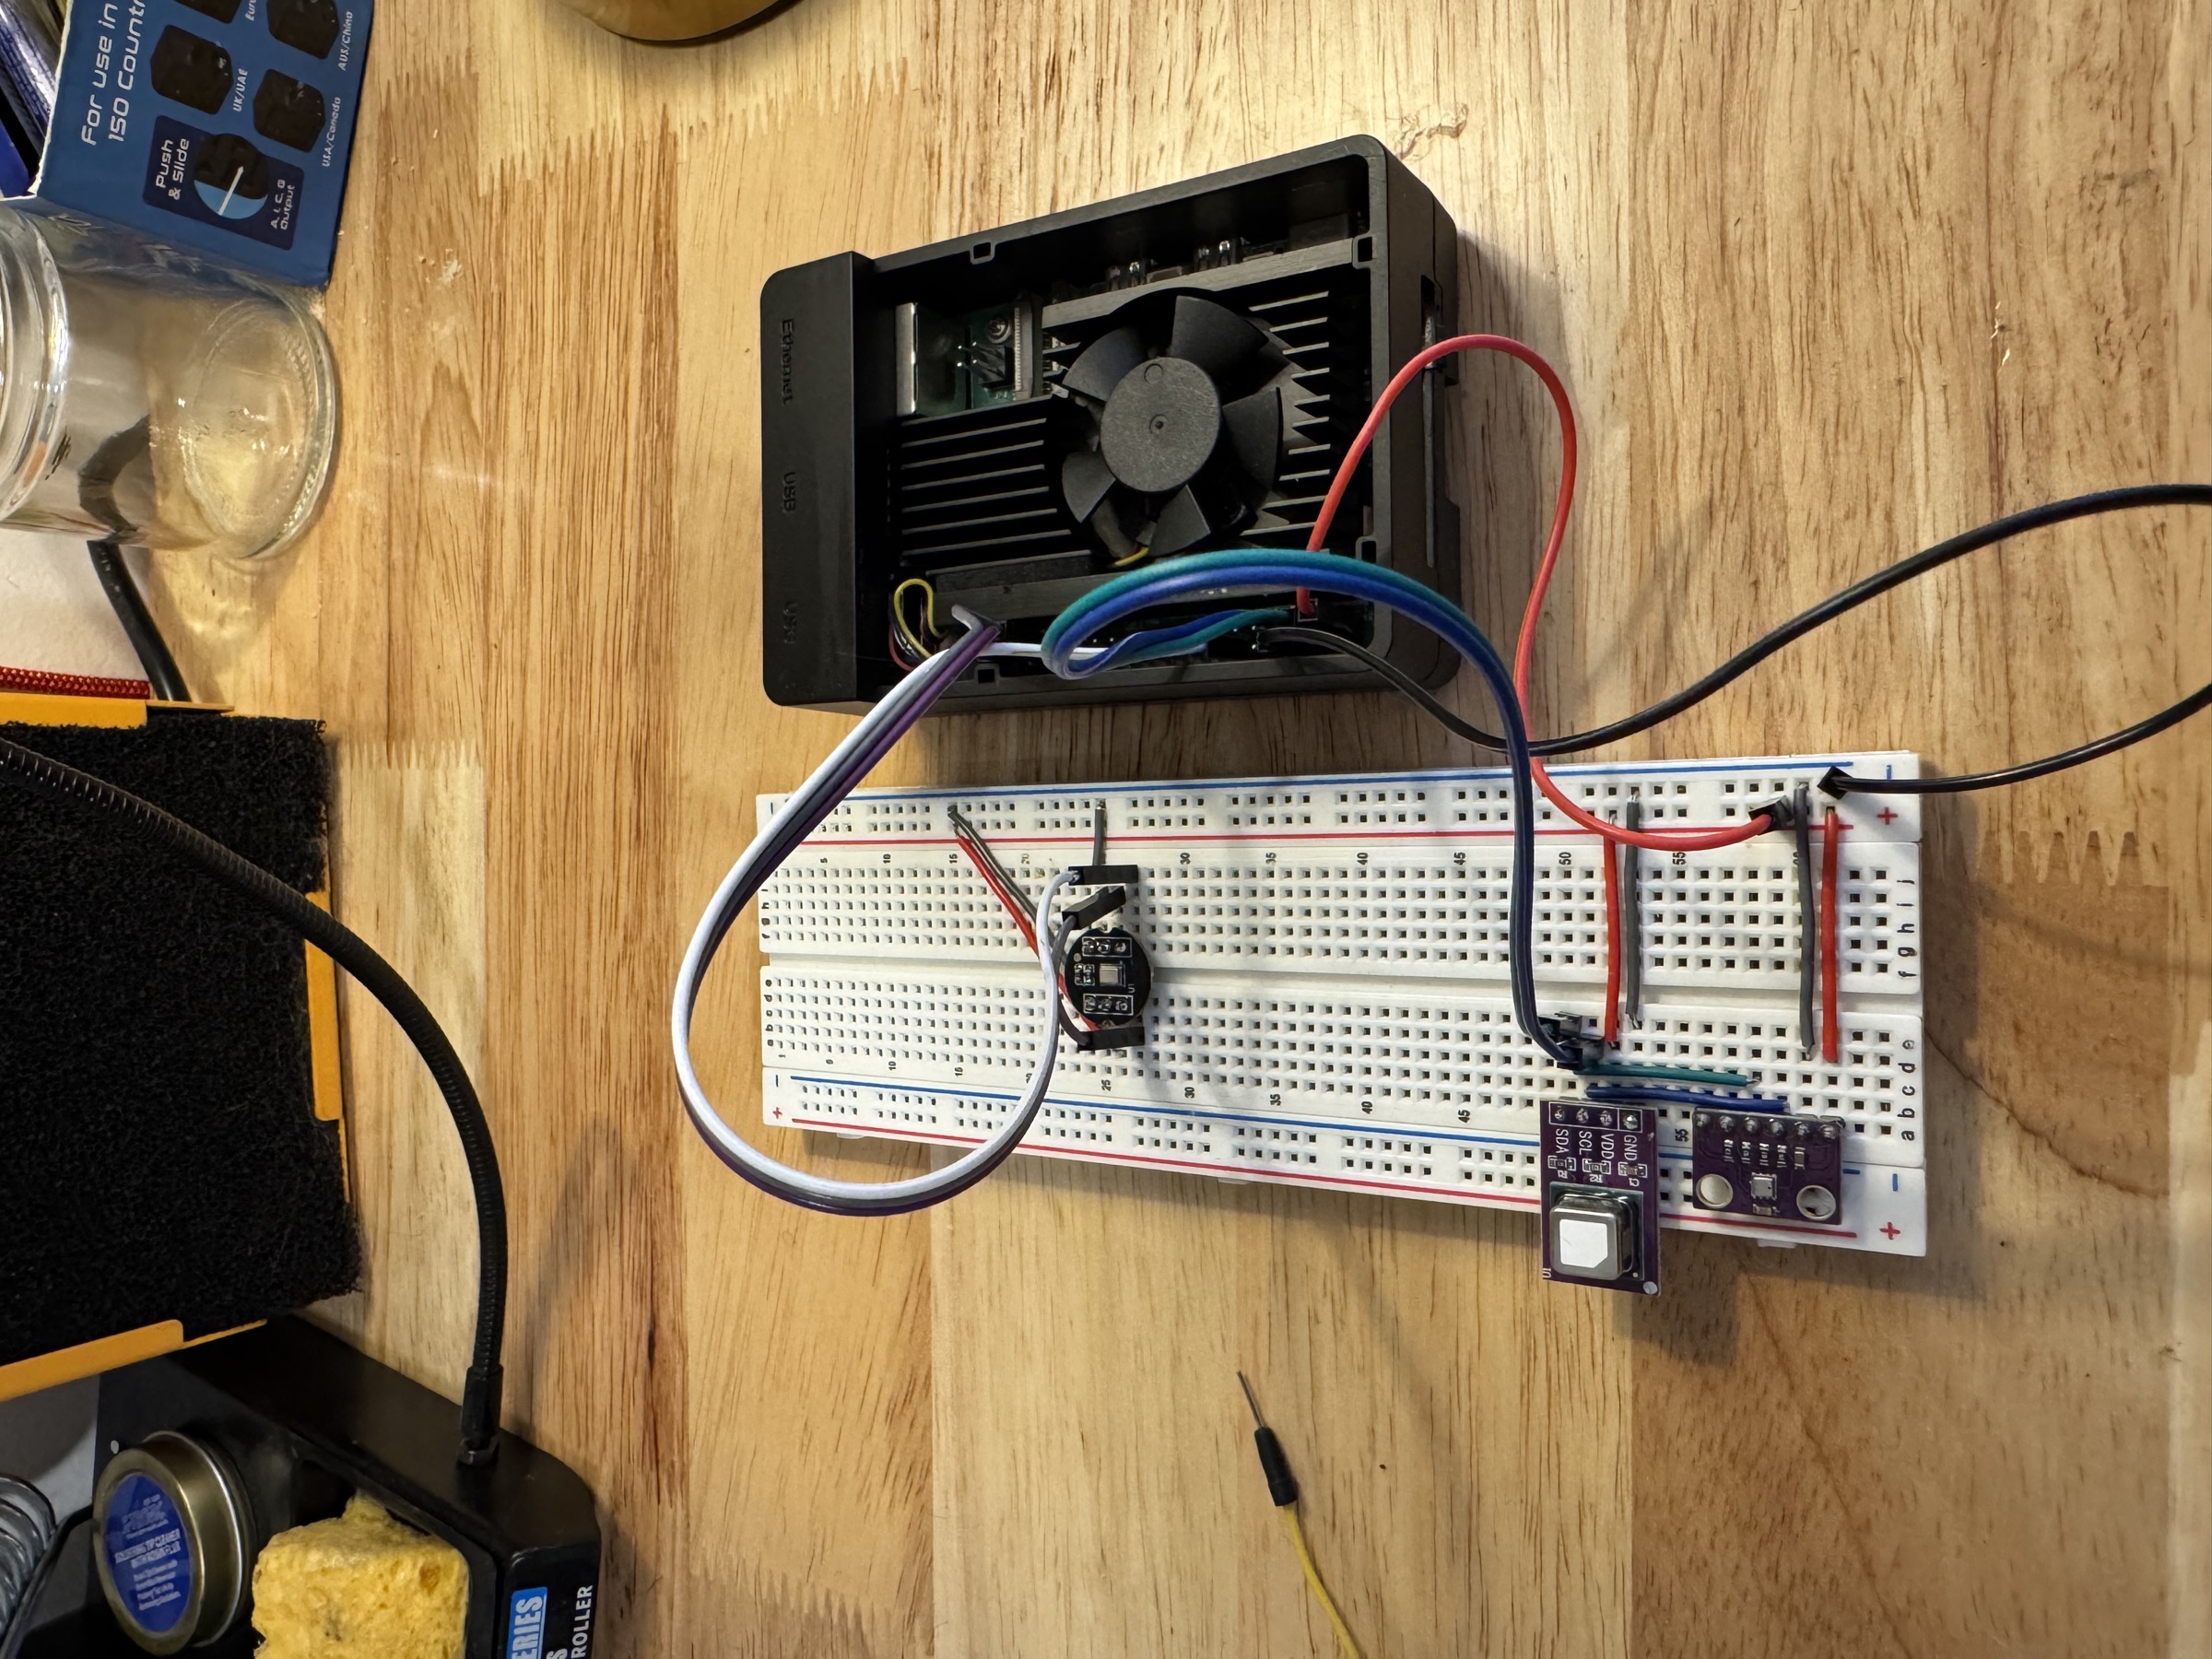
Power and ground feed the breadboard rails from the Pi. The BME280, SCD40, and SGP40 all use I2C, so they share SDA and SCL, the physical pins 3 and 5 on the header (GPIO 2 and 3). The INMP441 uses I2S: bit clock on GPIO 18, word select on GPIO 19, and data out on GPIO 20.
Technical Deep Dive
Event-driven architecture with MQTT
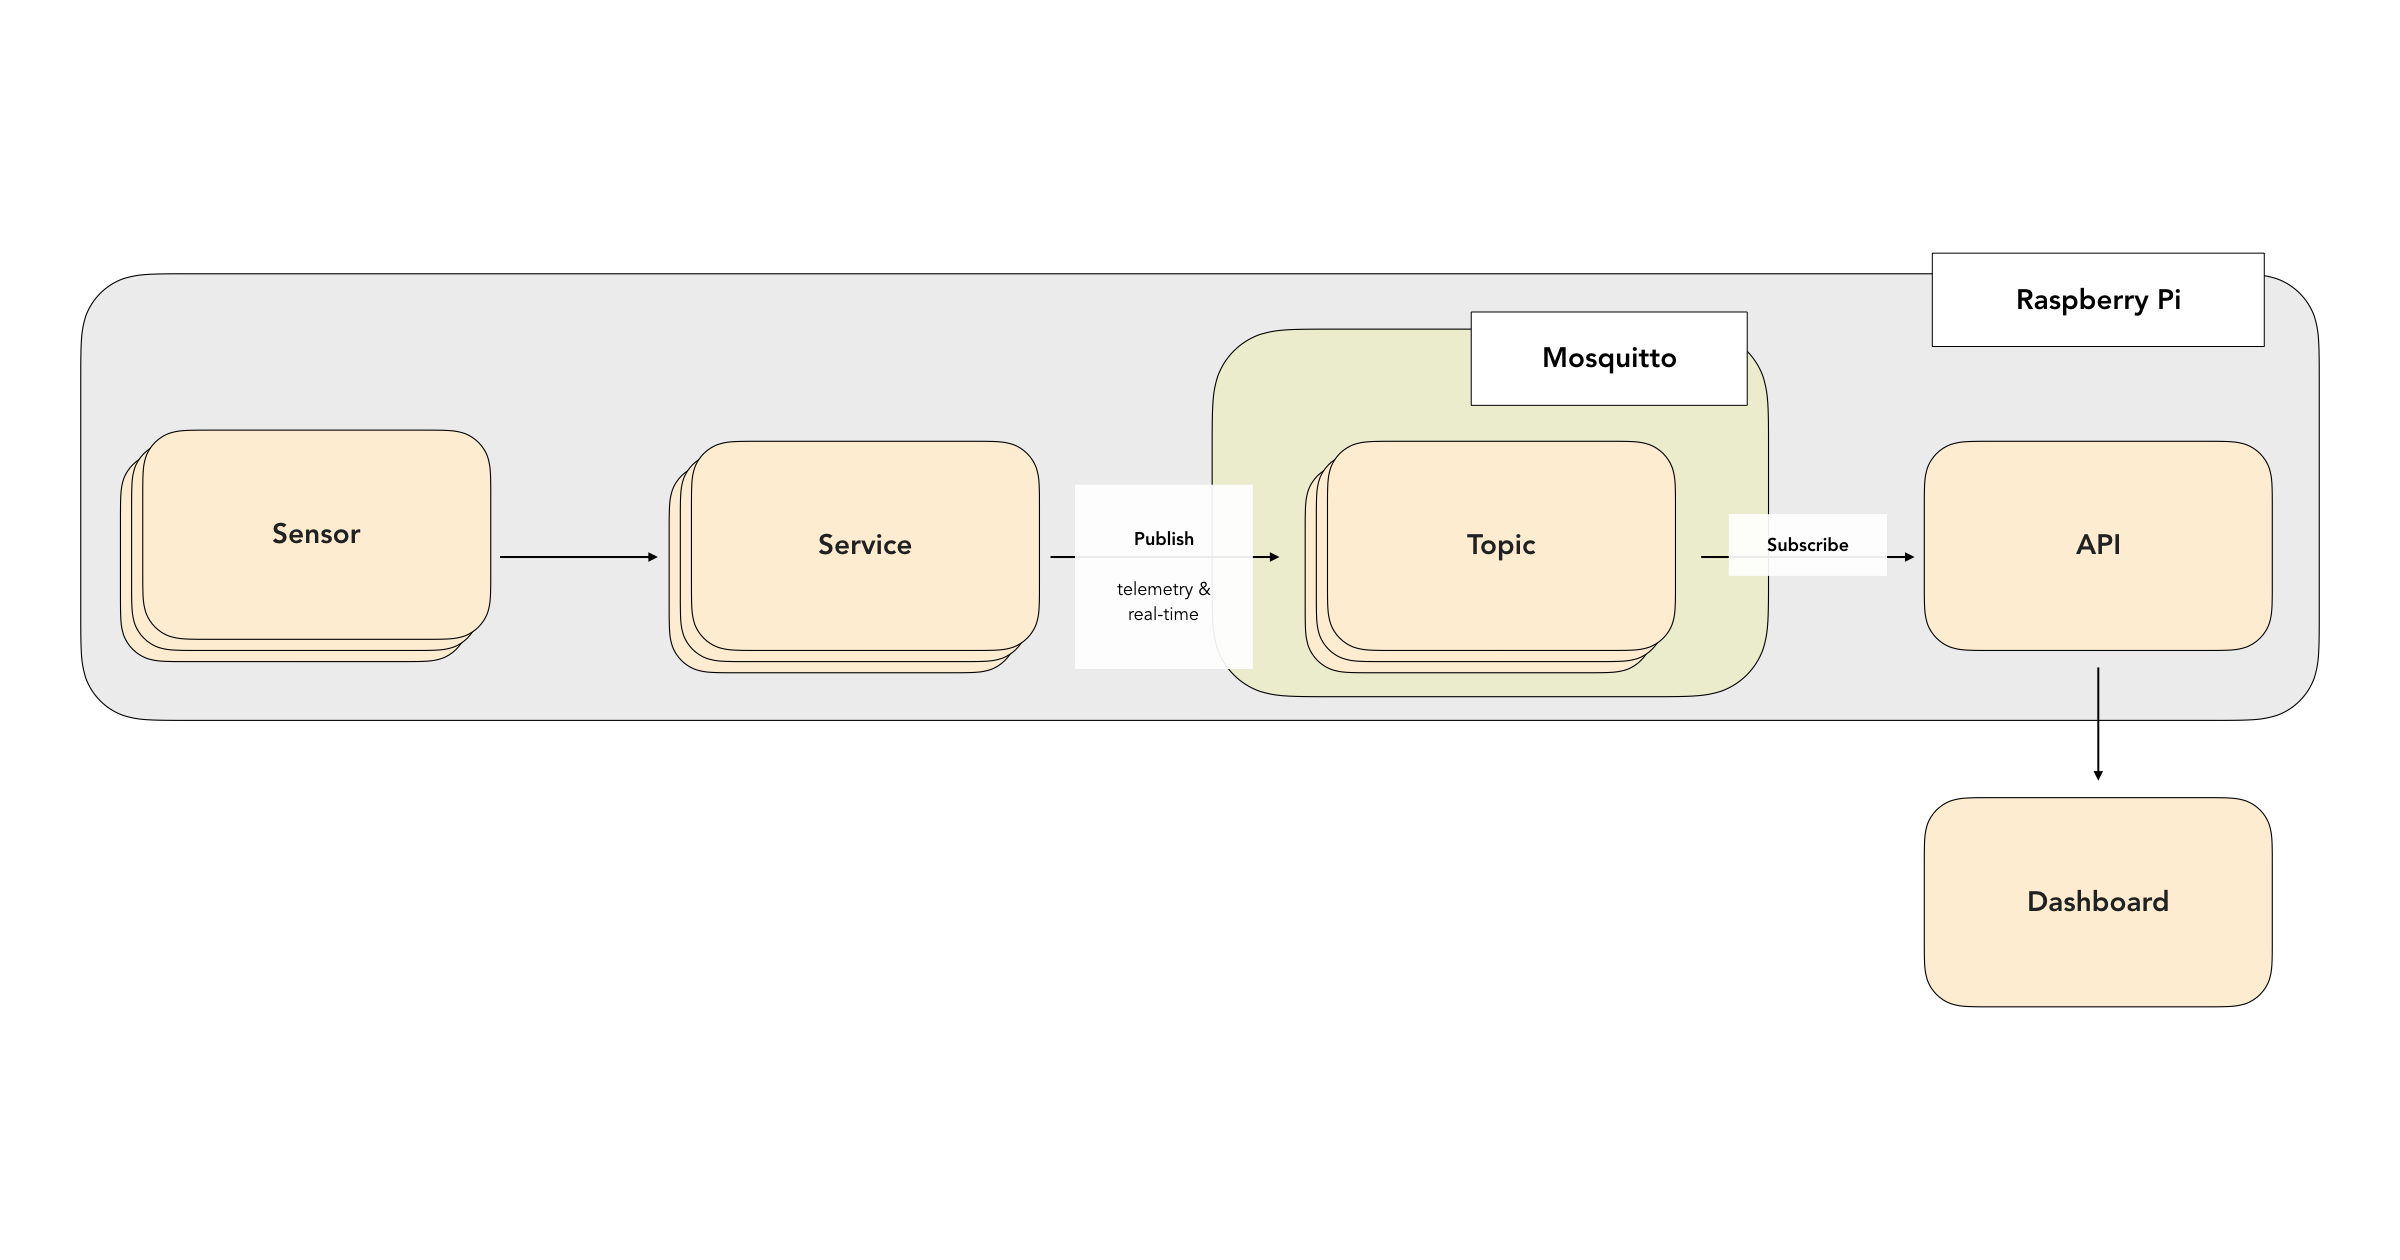
The core of the software is a Mosquitto MQTT broker on the Pi. Sensor services publish readings to the broker on dedicated topics and other services (like the API) subscribe.
The main benefit is separation of concerns. Each sensor has its own process and its own place on the bus. That process has one job: read the sensor, do a minimal amount of processing, and publish. It does not need to know how the other sensors work, or whether they are up, or how the data will be used. This separation of concerns has already proven useful. I have a hardware problem with the SGP40 right now, and while I debug it the rest of Arkadia keeps running and the dashboard marks that one panel as offline. It also makes it easier to add new sensors or displays in the future.
The bus carries two kinds of data: telemetry and live streaming. Temperature, CO₂, VOC, and the periodic decibel reading are telemetry: sampled every few seconds or every minute, where only the most recent value matters. The live audio signal for the equalizer is real-time and has to be processed as it arrives. The same broker handles both.
Telemetry data is published with retain=true, so the broker holds the most recent reading for each sensor. When the API restarts, the broker replays those retained messages and the API rebuilds its state immediately. The audio stream, on the other hand, is published at QoS 0 with no retain.
# Telemetry: guaranteed delivery, broker holds the latest value.
client.publish(summary_topic, summary_payload.model_dump_json(), qos=1, retain=True)

# Live audio: fire and forget, nothing kept.
client.publish(stream_topic, stream_payload.model_dump_json(), qos=0, retain=False)
I used hierarchical topics and wildcard subscriptions for easy extensibility. Topics are namespaced as home/sensors/{category}/{sensor_id}, and the API subscribes once to home/sensors/#. A new sensor shows up on the bus and the API picks it up without a configuration change.
I used a Last Will and Testament to let the broker report failures. Each service registers a will when it connects, so if it disconnects ungracefully the broker publishes {"status": "offline"} to home/status/{sensor_id} on its behalf. The sensor health indicators on the dashboard use this feature directly.
Comparing Mosquitto/MQTT to other options, Redis pub/sub is fire-and-forget with no per-topic retention and no will. ZeroMQ is brokerless, so there is no last-value cache and no liveness signal unless you build them.
Schemas and contracts
The bus decouples producers from consumers, and while this underpins the extensibility and resiliency of the system, it also means the various system components need to be strict about data schemas and contracts. Every reading goes out in the same envelope: a schema version, the sensor’s identity, a UTC timestamp, the values, metadata about how those values were produced, and optional service diagnostics.
{
  "schema_version": 1,
  "sensor_id": "bme280",
  "timestamp": "2026-05-08T14:23:01Z",
  "readings": {
    "temperature_c": 21.4,
    "humidity_pct": 43.2,
    "pressure_hpa": 1013.6
  },
  "meta": {
    "sample_count": 5,
    "aggregation": "median"
  },
  "diagnostics": {
    "uptime_seconds": 12345,
    "read_failures": 0
  }
}
The envelope and every sensor’s readings are defined as Pydantic models in a shared common package that all the services import, so the contract is enforced at both ends.
The meta section of the schema documents any aggregation or transformation that the producer does. The sensors are fallible, which raises a common design question: who is responsible for data processing steps? A simple heuristic: if a data processing step is generally applicable, it should be done by the producer. For example, no consuming service is ever likely to care about implausibly low or high temperature readings. Therefore, it is cleaner for the producer to take several readings and publish the median, rather than having every consumer deal with implausible values in repetitive and heterogeneous ways. On the other hand, if a data processing step is specific to a consumer, it should be done by that consumer. For example, converting units or displaying trends in the data is likely to be specific to a given consumer, so they should own it.
The REST API
It would be inconvenient, and usually brittle, to have every consumer read from the broker directly. So there is a FastAPI service between the bus and outside clients.
Beyond a normal HTTP interface, it does two things. First, it owns the business logic that every consumer should share but that is too high level to be done by the producers. For example, the API is where a sensor is treated as missing when nothing has ever arrived, and where a reading is marked stale when the newest one is too old.
Second, it is the security boundary. Mosquitto listens only on 127.0.0.1, so nothing on the network can reach MQTT at all. Outside consumers go through the API, which requires a key, as does the audio socket. This is a local, single-device deployment on a trusted network, so there is no TLS. If I ever exposed the API beyond the LAN, that would have to change, but only in one place.
Real-time audio
Most of the above is telemetry, which is familiar from my usual work. The live audio path was newer for me, and it speaks to my musical side. By integrating live audio into the monitor I can visualize the sound in the room as it happens. This feature is more about hobbies than health monitoring. For ear health, telemetry-oriented data from the microphone is sufficient (e.g. decibel levels over time). But I figured since I needed to hook up a microphone to the Pi anyway, I might as well cover real-time audio as well and have some fun.
You cannot get more "real time" than a fully analog path. I would like to build an analog waveform and graphic EQ someday that I can plug a guitar or a record player into. But Arkadia is digital and this writeup is about software.
The INMP441 turns incoming sound into a digital sample stream. The service captures that stream in fixed windows, and each window is one self-contained frame of work. The waveform panel draws the window directly as amplitude over time. The same window, run through a Fast Fourier Transform, becomes a set of frequency components, which are grouped into eight octave bands and drawn as a graphic equalizer. Here is the core of the FFT:
windowed = waveform * window          # Hann window, reduces spectral leakage
spectrum = np.fft.rfft(windowed)

# Normalize so a full-scale sine wave lands at 0 dBFS.
mags = np.abs(spectrum) / (window_size / 2.0)
mags_db = 20.0 * np.log10(np.clip(mags, 1e-10, None))
Those bins are then aggregated into ISO 266 octave bands. Each band spans from its center frequency divided by √2 to its center times √2. Decibels are logarithmic, so the arithmetic mean of a set of dB values is not the level of their combined energy. The bins have to be converted back to linear power, averaged there, and converted again:
for center in bands_hz:
    low, high = center / sqrt2, center * sqrt2
    mask = (freqs >= low) & (freqs < high)

    if mask.any():
        linear = 10.0 ** (mags_db[mask] / 20.0)
        mean_linear = float(np.mean(linear))
        levels_db.append(20.0 * math.log10(max(mean_linear, 1e-10)))
    else:
        levels_db.append(_DB_FLOOR)
Latency and sample rate
The sample rate is 48 kHz and the window size is 2,400 samples, yielding exactly 50 ms of sound. That means frames come out at 20 Hz, and the FFT produces 1,201 bins spanning 0 Hz to Nyquist at 24 kHz, spaced 20 Hz apart. A 2,400-point real FFT is on the order of N log₂ N ≈ 27,000 operations, which NumPy does in microseconds. Up until this point, the latency is dominated by the sampling time of 50 ms. I have not yet measured the rest of the path from finished frame to canvas draw, but it feels fairly responsive to the sound in the room.
Coding with AI
Just as in my current setup at work, I built everything via Cursor Cloud using Claude Opus. To test and deploy, I pulled each GitHub branch onto the Raspberry Pi and ran it there.
With agents writing most or all of the code for new projects like this, I need a clear vision and technical design up front. So I started with a technical design document, followed by a plan that broke the work into sequenced pull requests with acceptance criteria for each.
With a strong technical design in place for the agent to follow, most of the coding was on autopilot. Running on the edge was where the slowdowns showed up.
For example, I had to tackle some bugs related to the fact that the googlevoicehat-soundcard ALSA driver on the Pi 5 requires 48 kHz stereo capture rather than the initial 16 kHz design. I also had to work through mapping the mono signal from the INMP441 to the stereo channels, which depends on the physical wiring of the microphone.
Each of these debugging iterations involved pushing a branch, pulling it on the Pi, restarting the unit, and reading the journal. This was a good reminder of how much of my normal development speed relies on managed cloud infrastructure that I do not have to worry about.
Conclusion
Arkadia is a living project that combines my professional software engineering interests with personal hobbies like electronics and music. It is a platform for environment monitoring that supports extension and customization.
I was able to make a hobby system this flexible because of software concepts from my career. Event-driven architecture, separation of concerns, and clear contracts between services are what keep Arkadia running smoothly and what separate it from a typical hobby project. This was a chance to apply those tried-and-true principles in a setting outside of work.
Beyond getting reps with familiar concepts, I am most pleased with the new skills Arkadia provided — primarily live data streaming to the browser. That path was newer for me, so I found it important to review and internalize that code more than other parts of the codebase, rather than hand-waving and deferring. The next time I encounter a similar live streaming application at work or in a personal project, I should be able to provide more of a vision from the start.
Next on my list of enhancements is something like a PMS5003 to measure particulates. That would probably be the most helpful sensor for air quality during a wildfire, which was my original motivation for building Arkadia. After that, more in the spirit of the real-time audio and as an attempt to cover more of the human senses, it would be fun to incorporate optical sensors such as a VEML7700 and an AS7341 to report the intensity and composition of ambient light. I also want to extend the display side — an LED matrix as a physical monitor, rather than relying only on the web app.